Fatemeh Zamani Mazdeh1,2,
Afshin Rajabi Khorrami1,
Zhila Moradi-Khatoonabadi2,
Farideh EsmaeiliAftabdari2,
Mohammad Reza Shams Ardekani2,
Ghazaleh Moghaddam3,
Mannan Hajimahmoodi2,3 ![]()
For correspondence:- Mannan Hajimahmoodi Email: hajimah@sina.tums.ac.ir Tel:+982166954714
Received: 18 February 2015 Accepted: 7 November 2015 Published: 29 January 2016
Citation: Mazdeh FZ, Khorrami AR, Moradi-Khatoonabadi Z, EsmaeiliAftabdari F, Ardekani MR, Moghaddam G, et al. Determination of 8 synthetic food dyes by solid phase extraction and reversed-phase high performance liquid chromatography. Trop J Pharm Res 2016; 15(1):173-181 doi: 10.4314/tjpr.v15i1.24
© 2016 The authors.
This is an Open Access article that uses a funding model which does not charge readers or their institutions for access and distributed under the terms of the Creative Commons Attribution License (http://creativecommons.org/licenses/by/4.0) and the Budapest Open Access Initiative (http://www.budapestopenaccessinitiative.org/read), which permit unrestricted use, distribution, and reproduction in any medium, provided the original work is properly credited..
Purpose:To develop a simple, selective, and sensitive extraction and assay method for the analysis of eight food dyes.
Methods:All sulphonated colors were extracted by an NH2-aminopropyl-modified silica SPE cartridge, and thereafter determined by reverse phase high performance liquid chromatography (RP-HPLC) using a C18 column with gradient elution of ammonium acetate buffer (pH 6.7), methanol, and acetonitrile. The analysis was carried out on a UV detector with two optimized method settings within 17 min.
Results:Certificated standard material (CRM) was used to validate the method, and significant difference was not observed between the results and assigned values. Maximum LOD was 1.154 ppm at 250 nm for Brilliant blue, and 0.873 ppm for carmoisine. Recovery was 94.2 % for Brilliant blue in jelly powder.
Conclusion:This method was successfully applied to determine colorants in various (30) water-soluble foods, including fruit flavored drinks, sugar confectionery, sweets, etc.
Introduction
One of the main groups of food additives are synthetic dyes. Most of them are acidic and water-soluble substances. They are used widely to optimize and compensate for food color, because freshness, ripeness, and flavor are all associated with food color. Also, some studies report the potential risks of food colorants to human health, such as an increased risk of hyperactivity in children, especially when they are consumed excessively [1]. The usage of food colorants is strictly controlled by legislation in the European Union, with Directive 94/36/EC, in which the type and maximum quantities allowed for coloring foodstuffs are noted [2]. Countries are being impressed upon to consider the maximum utilization of food colorants based on international standards. Despite this, the synthetic colors accepted by Iranian national standards have only been qualified; unfortunately, there are limited reports on their amounts in foodstuffs. [3,4].
Based on the international standards of agencies, such as the United States Department of Agriculture (USDA) and U.S. Food and Drug Administration (FDA), all food color additives are required to be labeled. Some people are sensitive to particular food colorants; the names of the colors existent in a food product must be the same as those on its label. Thus, measurement of dyes is required to ensure food safety.
Many analytical techniques have been used in identifying and determining synthetic food colors, such as: thin-layer chromatography (TLC) [5], adsorptive voltammetry [6], differential pulse polarography [7], and electrophoresis [8-10]. It seems, however, most of them need time-consuming pretreatment and cannot be applied to complex color mixtures.
Liquid chromatography is commonly applied for the separation, qualification and quantization of food colorants. High-performance ion chromatography [11], reversed-phase liquid chromatography [12-14] and ion-pair liquid chromatography [15-20] are the most preferred methods, as they provide high resolution, sensitivity, and selectivity. Solid phase extraction is selected reduce the effect of matrix interference and enrich analyte. Hydrophobic polymeric sorbents (C2, C8, C18, and St-DVB), hydrophilic polymeric sorbents (Oasis HLB), ion-exchange sorbents (SAX), and mixed-mode ion-exchange sorbents (PAX, MAX) are used as SPE for extraction [21].
Lists of permitted food colors differ from country to country. In Iran, seven synthetic colorants are approved for use in foodstuffs: Sunset yellow, Indigo carmine, Carmoisine, Quinoline yellow, Ponceau 4R, Allura red, and Brilliant blue. Based on Iranian standards [22], the Tartrazine consumption is not confirmed, but it is the most commonly used colorant in Iran. The TLC technique is a routine qualitative method to detect food colorant type in Iranian standards; however, it isn’t precise or accurate for determination.
Currently, seven synthetic colorants other than Tartrazin are permitted for use as food additives in the national Iranian standards (NO: 740). This work aimed to develop a practical, simple, selective, and sensitive method for monitoring eight food colorants in a single run to apply in food control laboratories.
Methods
Chemicals and reagents
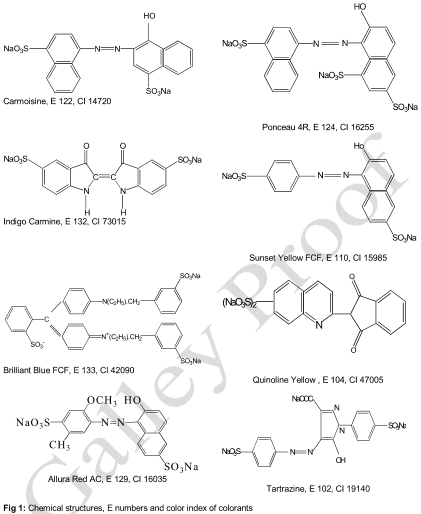
In this study, high purity standard of Tartrazine (E 102) (99 % purity), Sunset yellow FCF (E 110) (95 % purity), Quinoline yellow (E 104) (95 % purity), Indigo carmine (E 132) (98 % purity Quinoline yellow), Carmoisine (E 122) (98 % purity), Ponceau 4R (E 124) (99 % purity), Allura red AC (E 129) (98 % purity) and Brilliant blue FCF (E 133) (98 % purity) were purchased from Sigma-Aldrich (Wisconsin, WI, USA). The chemical structures, European community numbers (E numbers), and Color Index denominations (CI numbers) are illustrated in .
Methanol, acetonitrile (HPLC grade), ammonia solution (25 %) and ammonium acetate (98 %) were acquired from Merck (Darmstadt, Germany). Deionized water was prepared by the Thermo Scientific Branstead Easypure II system.
Chromatographic conditions
The separation was carried out by Agilent 1200 series liquid chromatography equipped with a gradient pump capable of mixing up to four solvents, a vacuum membrane degasser, a 20 µL loop injector, and a (G1314B) UV Detector. An Eclipse-XDB C18 column (250 mm × 4.6 mm, 5 µm) from Agilent Technologies (CA, and USA) was selected as the most common column type.
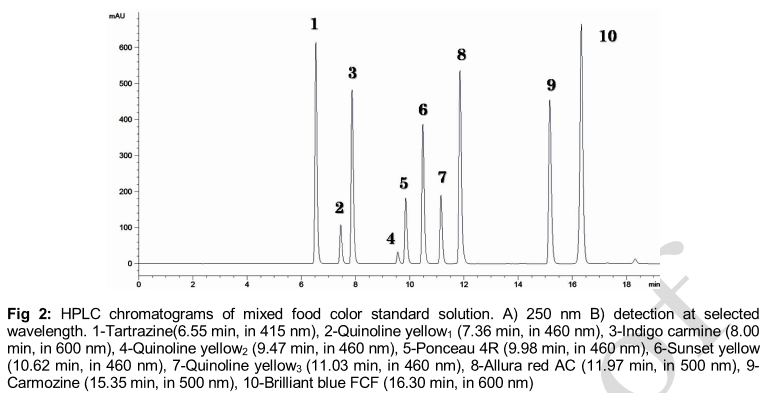
The mobile phase consisted of ammonium acetate solution (0.1 mol L-1, pH = 6.7) as solvent A and methanol-acetonitrile (50:50, v/v) as solvent B. The buffer solution was filtered by cellulose membrane with a pore diameter 0.45 μm. In order to attain a successful resolution, gradient elution programs were tested and the flow rate was always kept constant at 1 ml min-1. The final optimized gradient program was 3 % solvent B as the initial step; then it increased to 60 % in 18 min and was held for 2 min. The column was kept at room temperature and initially conditioned for 5 min before each analysis. [20] The UV detector was optimized with two conditions. First, the fixed wavelength was set at 250 nm within the whole runtime to make it easy to use for amateur operators; next, it was programmed at 415 nm for tartrazine, 460 nm for quinoline yellow, Ponceau 4R, and Sunset yellow, 500 nm for Carmosine and Allura red AC, and 600 nm for Brilliant blue and Indigo carmin ().
Color standard solutions
All the individual standard stock solutions (1000 mg L−1) were prepared in deionized water and kept in the dark place before use. The working standard were getting ready fresh by mixing appropriate amounts of stock solutions with deionized water to give a concentration between 5 and 100 mg L−1 and stored at 4 ºC in the dark for 2 weeks.
Solid phase extraction
The characteristics of the NH2-aminopropyl-modified silica cartridge are 3 ml, 500 mg, with 60 A mean pore diameter and 45 µm mean particle size. All the samples were obtained from the local market and consisted of drinks, jelly powder, jelly gum, chocolate in crisp sugar shell (Smartize), candy, and toffee.
A mass of 10 g liquid sample was weighed in a 25 mL beaker, then 10 mL deionized water was added and was adjusted to 7 with an ammonium solution 0.1 M. Finally, the sample was diluted to 25 mL with deionized water. It must be noted that carbonated liquid samples had to be degassed by ultra-sonication for 10 min, about 10 g solid sample was placeded in a 100 mL beaker and dissolved in 30 ml deionized water at 60 ºC. The pH adjusted to around 7 with 1 % ammonia solution.
Next, it was diluted with deionized water to 50 ml in a volumetric flask. For Smartize, titanium dioxide dispersion (the shell) was prevented by shaking to remove dyes. Then the uncolored residue was separated by centrifugation for 15 min at 5000 rpm. After that, the supernatant was decanted for SPE.
The solid phase extraction was performed with a NH2-aminopropyl-modified silica cartridge, which was conditioned with 1 mL methanol and 1 mL water continuously.
After conditioning, 1 mL prepared sample solution was loaded on the NH2-aminopropyl-modified silica SPE cartridge, washed with 1 mL water, and eluted with 1 mL 5 % ammonia solution by 60 drops/min. Samples were filtered with 0.45 µm cellulose disposable syringe filters before injecting to the HPLC.
Method validation
The method validation was performed following the International Conference on Harmonization (ICH) guidelines [24]. Calibration curves were drowned by six different concentrations between 5 and 50 mg L-1 for each colorant with three replicates, and the correlation coefficient was assessed.
The limits of detection (LOD) and quantification (LOQ) were characterized by considering respectively 3.3 and 10 times the residual standard deviation of a regression line to the slope of the calibration curve [24,25].
Results
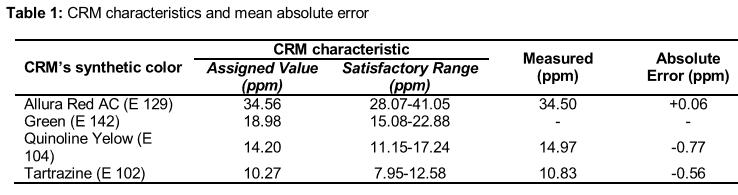
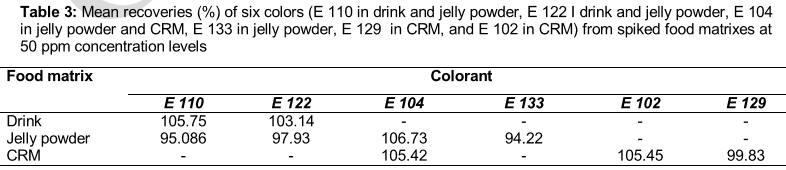
In order to evaluate accuracy, recovery measurement was carried out by spiking definite values of the considered dyes to the sample. Moreover, one CRM from FAPAS (reference number: T0394) was evaluated to obtain the accuracy of the method. The characteristics of this CRM are displayed in .
Method validation
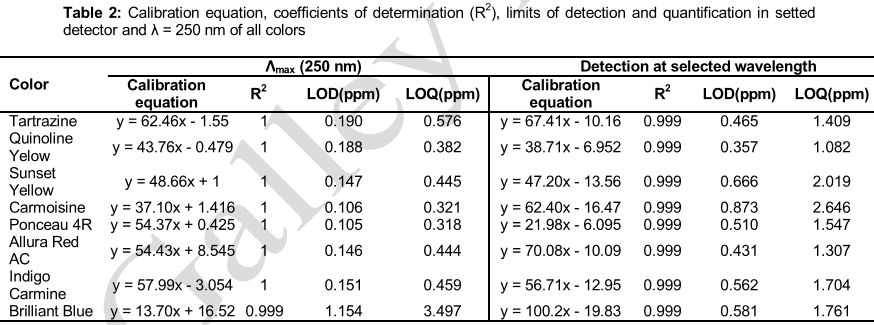
In the case of selectivity, calibration equations were accounted by the peak area of the compounds. Calibration plots for Quinoline yellow was made via sum of the peak areas of the three isomers [23]. Calibration equations coefficients of determination (R2), LOD, and LOQ are given in .
Under the optimized experimental conditions, desirable linearities were evaluated among the peak area responses and concentrations in the limit of 5 to 50 ppm. In a fixed 250 nm wavelength, the LOD values varied between 0.105 ppm in Ponceau 4R to 1.154 in Brilliant blue, and the LOQ ranged between 0.318 and 3.1496 ppm. However, for optimized varied setting wavelengths, the minimum and maximum LOD were 0.873 and 0.357 for carmoisine and Quinoline yellow, respectively (). Recovery data in the two different matrixes and CRM are reported in .
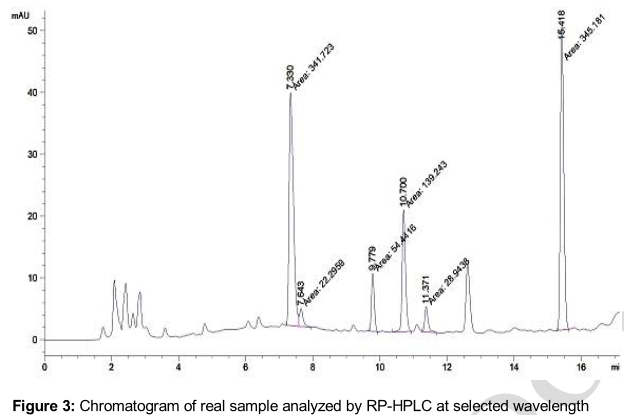
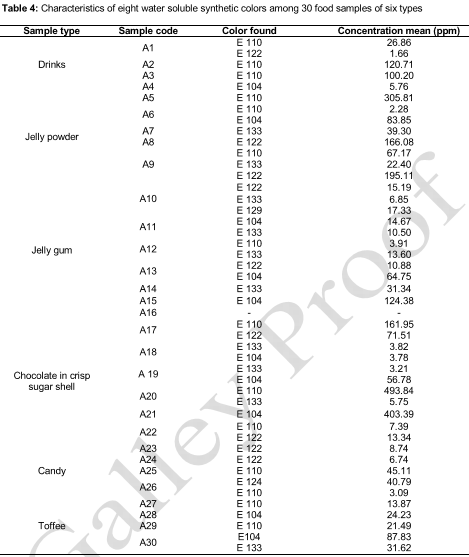
This value ranged from 94.22 % for E133 in jelly powder to 106.75 % for E110 in drinks. The procedure was applied color analysis in 30 commercial products, from six food category. The samples from each type had different product licenses, so for each were analyzed separately and their means were reported. A chromatographic profile of a real sample extract fortified with food colors is presented in .
Moreover, the studies on some real samples such as saffron showed that the SPE cartridge did not absorb any natural colors. Analysis of one jelly gum sample (A16) also confirmed these results. Information obtained shows that six of the eight colorants were detected at least once.
The food colorant concentrations in the samples ranged as follows: Quinoline yellow (3.8-403.4 ppm, 10 samples), Sunset yellow FCF (2.3 - 493.8 ppm, 14 samples), Ponceau 4R (40.8 ppm, one sample), Carmiosine (1.7-195.1 ppm, nine samples), Brilliant blue FCF (3.2-39.3 ppm, 11 samples) and Allura red AC (17.3 ppm, one sample). In other hand the results were mentioned the usage of synthetic colors in samples collected from the market in a wide concentration range, but Tartrazine and Indigo carmine were not observed in none of commercial products.
Discussion
For most LC methods, synthetic colorants must first be extracted from the food matrices and purified prior to chromatographic analysis.[26] Solid phase extraction (SPE) is an effective sample preparation method and it is common purification in chromatography process methods today [21]. The principal aim of using SPE is to reduce the interfering matrix components by selective analyte isolation.
Different sorbents for separating colors from foods have been elaborated by solid-phase extraction (SPE), such as ODS [17,27], quaternary amine[18], and polyamide [15,28]. We can reported at this work, NH2-aminopropyl-modified silica SPE extracted eight synthetic food dyes.
Ion exchanger applied for anionic compounds that can be isolated on strong anion exchanger (SAX) or weak anion exchanger (WAX) bonded silica cartridges. The electrostatic attraction between the charged functional groups on the compound and the ionic groups of SPE is the primary retention mechanism. Alternatively, the high ionic strength solution is selected as appropriate eluent. The SAX material is made up an aliphatic quaternary amine group that is bonded to the silica surface. SAX is chosen to extract strong anions only when recovery is not desired. In one of the previous studies, the polyamide cartridge was recommended for extraction of dyes in food with lower recovery than in the current study [23].
NH2-aminopropyl-modified silica as a WAX SPE is more useful in extracting colorants from food matrixes when the analytes are food colorants [29]. The pKa of NH2 SPE is around 9.8, and based on the SPE application guidelines; the pH adjustment of the sample solution for loading on the cartridge set to approximately 7 [22]. The extraction efficiency of CRM colors in different pH values was studied and the results showed that these food colorants are adsorbed on cartridge most strongly at pH 7.
NH2 SPE provides a convenient method for extracting and purifying eight colors from different foods. One of the best method for qualitative and quantitative determination of synthetic dyes is a reversed phase high performance liquid chromatography (RP-HPLC) [23]. As regards the hydrophobic properties of food colorants and the presence of acidic and alkaline groups (), the ammonium acetate buffer as a common inorganic electrolyte is chosen as mobile phase with the mixture of methanol–acetonitrile. The optimized concentration ammonium acetate concentration for peak symmetry and suitable separation was obtained 0.1 M [24,26]. This buffer solution not only is stable but does not interact with the HPLC system and is adequate for UV absorbance measurements [11].
The presence of acidic and alkaline groups with a naphthalene ring and also the pH of the mobile phase can influence the elution sequence. To choose the suitable pH, the separation was repeated with mobile phases at three different pH values (3.5, 5 and 7) between 3 and 7, according to Hajimahmoodi et al [4]. Using pH=7 to acetate buffer solution, all colorants are symmetrical and have a lower tailing. Due to high acidity of the colors, the peak shape and resolution are strongly influenced by the pH selected for the mobile phase. Therefore, in this study, the pH of ammonium acetate was adjusted to seven [30].
Dinc et al compared methanol, acetonitrile, and a mix of methanol–acetonitrile as common reversed-phase solvents in food colorant analysis. The use of acetonitrile significantly improved the asymmetry of the peaks, which gave the best separation when used with methanol (methanol–acetonitrile (50:50, v/v)) [31].
In another study, a similar method was applied with a phosphate buffer and diode array detector to determine three colorants in drinks; however, the advantages of this study are the determination of eight synthetic colorants simultaneously, determination for various matrixes of food, and use of a UV detector [32].
Gradient elution without an ion-pair reagent was also adopted for the analysis of eight colors with a shorter run time. A mixture of ammonium acetate buffer and methanol–acetonitrile was used for the gradient elution to separate successfully eight synthetic food colors in standard solutions [17]
The colors had different absorption spectra and could be analyzed at different wavelengths. The use of a photodiode array detector can solve this problem; however, the UV detector is available in most laboratories and is also recommended. In this study, the analyses were performed on a UV detector with two optimized methods. In the first method, the absorption spectra of food colorants were recorded at 250 nm constantly, and in the second procedure the column elutions were monitored at 415, 460, 500 and 600 nm, respectively. These colorants were detected in the wavelengths nearest their own maximum absorption [23]. The chromatograms obtained from the two optimized setting wavelength detector are presented in .
It must be noted that using SPE can reduce many interfering peaks while using 250 nm wavelength detection. Therefore, a clean-up procedure using solid phase extraction which can extract colors from impurities was recommended in our report. The peak was identified by comparing the retention times and absorption spectra of the samples with standard colors. The recoveries were slightly better than those reported in literature [17-19]. The method was also validated using a CRM sample. All defined color concentrations in this sample were in the satisfactory range and very close to their assigned respective values, indicating suitable method accuracy and precision ().
In previous studies that using specifically detector, the LOD and LOQ were lower values of this study [11,23]. Since, permissible colorants are added to food in levels higher than ppb levels. Therefore, in our study, these levels of LOD and LOQ are acceptable. Moreover, by using the SPE preparation, are concentrated analyte for determination in lower level [11,33].
showed the frequencies of colorants used as follows: Sunset yellow in drinks and jelly powders, Brilliant blue in jelly gums, Brilliant blue and Sunset yellow in Smartize, Carmoisine and Sunset yellow in candies and Quinoline yellow and Sunset yellow in toffee. According to , Sunset yellow in 14, Quinoline yellow in 10 and Brilliant blue in 10 samples were detected more than the other colorants. Moreover, Smartize contained the maximum amount of Sunset yellow (493.84 mg kg-1), followed by Quinoline yellow (403.39 mg kg-1) in Smartize and Carmoisine (195.11 mg kg-1) in jelly powder.
Conclusion
This study describes a method using simple equipment usually found in most food control laboratories. This method can be applied to determine eight colorants in various water-soluble foods, such as drinks, sugar confectionery and sweets. This method affords highly precise and accurate quantification of eight colorants at very low concentrations (ppm range). Excellent absolute recovery is achievable, and gives reliable and reproducible results with satisfactory detection limits and short analysis time for the analysis of food colorants. The approved standard method for food color evaluation in Iran is TLC technique, which is not an accurate quantification method. The findings of the present indicate that the developed method can be recommended to codify a new standard for the limit definition of food colorants in Iran.
Declarations
Acknowledgement
References
Archives


News Updates